Welcome
Come on in and feel free to look around. You'll find a lot of information about who I am and my various projects. If you don't find what you're looking for, feel free to contact me.
Lead Front End Developer
As a principle front end developer here at Velir, I work with a team of other talented developers to design and build websites and applications. In this role, I take part in creating and integrating user interfaces, upgrading applications, and working within the company's network. Typical tasks include mentoring a team of developers to help build their skills while completing projects on time.

Be Silly, Be Honest, Be Kind
The thing I love most in this world is to hear my wife laugh and the worse thing is to hear her cry. Making people happy, makes me happy and I try to bring that attitude to work everyday. Each day, I do what I can to help my co-workers enjoy what they're working on and who they're working with. It's important to try to determine the goal of each task or project to better understand how to make the client happy and to find a solution that you enjoy building.

Pure CSS
As a learning exercise, I wanted to see how far I could push CSS to create graphics. As a starting point, I found a Flat Design of a classroom and then tried to copy it using just CSS. By leveraging linear and radial gradients and a heaping of transforms, I was able to create, what I think was, a pretty good match while adding some extra elements like a clock that is accurate to the local time and an interactive mouse.
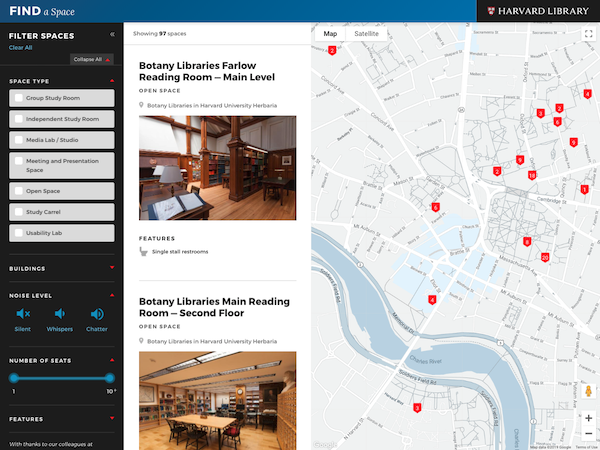
Space Finder
One of the items requested for Harvard Library's website redesign was an app that students could use to find and book study rooms. The client had found an app at Cambridge University and asked if we could build something similar. Using React and CSS animmations, we were able to build a modern version while keeping a similar User Interface.
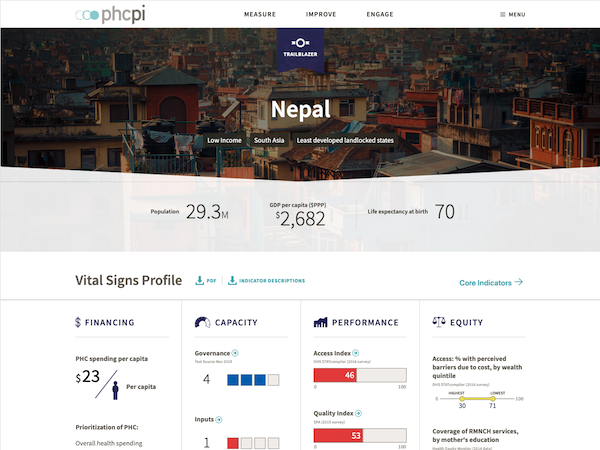
Data Visualizations
For PHCPI's latest Data Visualization, I decide to experiment to see if I could create these graphs using CSS instead of relying on D3. The plan was to make each graph a React App that received the color and value(s) to render. React would then convert those values into inline styles (max-width, positioning, background) where needed. All the graphs were doable with CSS, but we did use D3 to render the pie chart.